AXL/USDT Analysis: Potential Long-term Upside from $0.46 - $0.56
cashback-ventures

مشخصات معامله
قیمت در زمان انتشار:
۰.۷۳۵۶
توضیحات
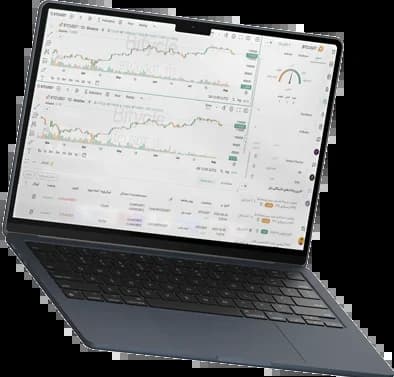
The chart indicates a possible bullish setup for AXL/USDT on the daily timeframe. The price is currently testing the support zone between $0.46 and $0.56, suggesting a potential entry point for a longer-term upward move targeting $2.1.
Detailed Analysis:
Price Structure:
AXL/USDT has been in a downtrend, followed by a consolidation phase near the support zone at $0.46 - $0.56. This range has acted as a strong support in the past, suggesting a potential base for a bullish reversal.
The price action in this area shows the possibility of an accumulation phase, which could serve as the foundation for a long-term rally.
Entry Price:
The ideal entry zone is within $0.46 - $0.56, where the price is currently consolidating. This support range presents a lower-risk entry point, supported by potential bullish momentum building in the coming weeks.
Target Price:
The long-term target price is set at $2.1, which corresponds to the previous major resistance level and aligns with the projected potential for a breakout from the accumulation zone.
Key Support & Resistance Levels:
Support: $0.46 - $0.56 (current entry zone)
Resistance: $0.93 (intermediate resistance), $1.52 (major resistance), and $2.1 (long-term target).
Risk Management:
Stop Loss: A stop-loss can be placed below $0.45 to limit downside risk, as a break below this level could invalidate the current bullish setup.
Trade Plan Summary:
Entry Zone: $0.46 - $0.56
Take Profit: $2.1 (long-term target), with potential intermediate resistance at $0.93 and $1.52.
Stop Loss: Below $0.45
Conclusion:
AXL/USDT is currently forming a potential bullish base at a strong support zone, suggesting a long-term buying opportunity. The analysis indicates a potential upside toward $2.1 if the support holds and the price breaks through the intermediate resistance levels.


BTC/USD: سیگنال خرید قدرتمند؛ بازگشت صعودی از هدف 83,500 دلار
حدود 1 ساعت قبلبهروزرسانی ۳ BTCUSDT: کف 79.5K در حال آزمودهشدن است؛ تصمیم کمیته بازار آزاد فدرال تعیینکننده خواهد بود
حدود 1 ساعت قبلتحلیل قیمت اتریوم | ریزش یا بازگشت؟
حدود 1 ساعت قبلXRPUSDT: بازگشت قیمت با مقاومت روبهروست و فروشندگان همچنان فعالاند
حدود 2 ساعت قبلمنتخب سردبیر
مشاهده بیشتردستیار هوشمند ارز دیجیتال
ترمینال ترید بایتیکل نرمافزار جامع ترید و سرمایهگذاری در بازار ارز دیجیتال است و امکاناتی مانند دورههای آموزشی ترید و سرمایهگذاری، تریدینگ ویو بدون محدودیت، هوش مصنوعی استراتژی ساز ترید، کلیه دادههای بازارهای مالی شامل دادههای اقتصاد کلان، تحلیل احساسات بازار، تکنیکال و آنچین، اتصال و مدیریت حساب صرافیها و تحلیلهای لحظهای را برای کاربران فراهم میکند.